Location: $SCIG/examples/scintillator_array
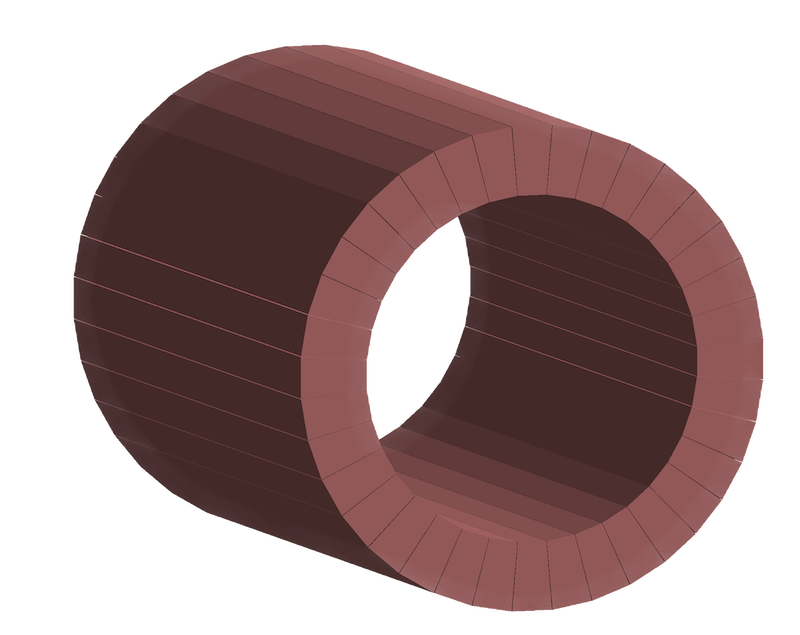
The setup is an array of scintillator bars in a cylindrical configuration. The bars are trapezoids to maximize the surface area.
The geometry is constructed using the python script:
./scintillator_array.py
The output is defined by the entry +goutput in the jcard ‘scintillator_array.jcard’.
Two format are written out: ‘text’ and ‘root’.
Sets the desired number of cores, number of events, and verbosity in the jcard ‘scintillator_array.jcard’. To run gemc:
gemc scintillator_array.jcard
Use the -gui option to run interactively:
gemc simple_flux.jcard -gui
The geometry looks like this:
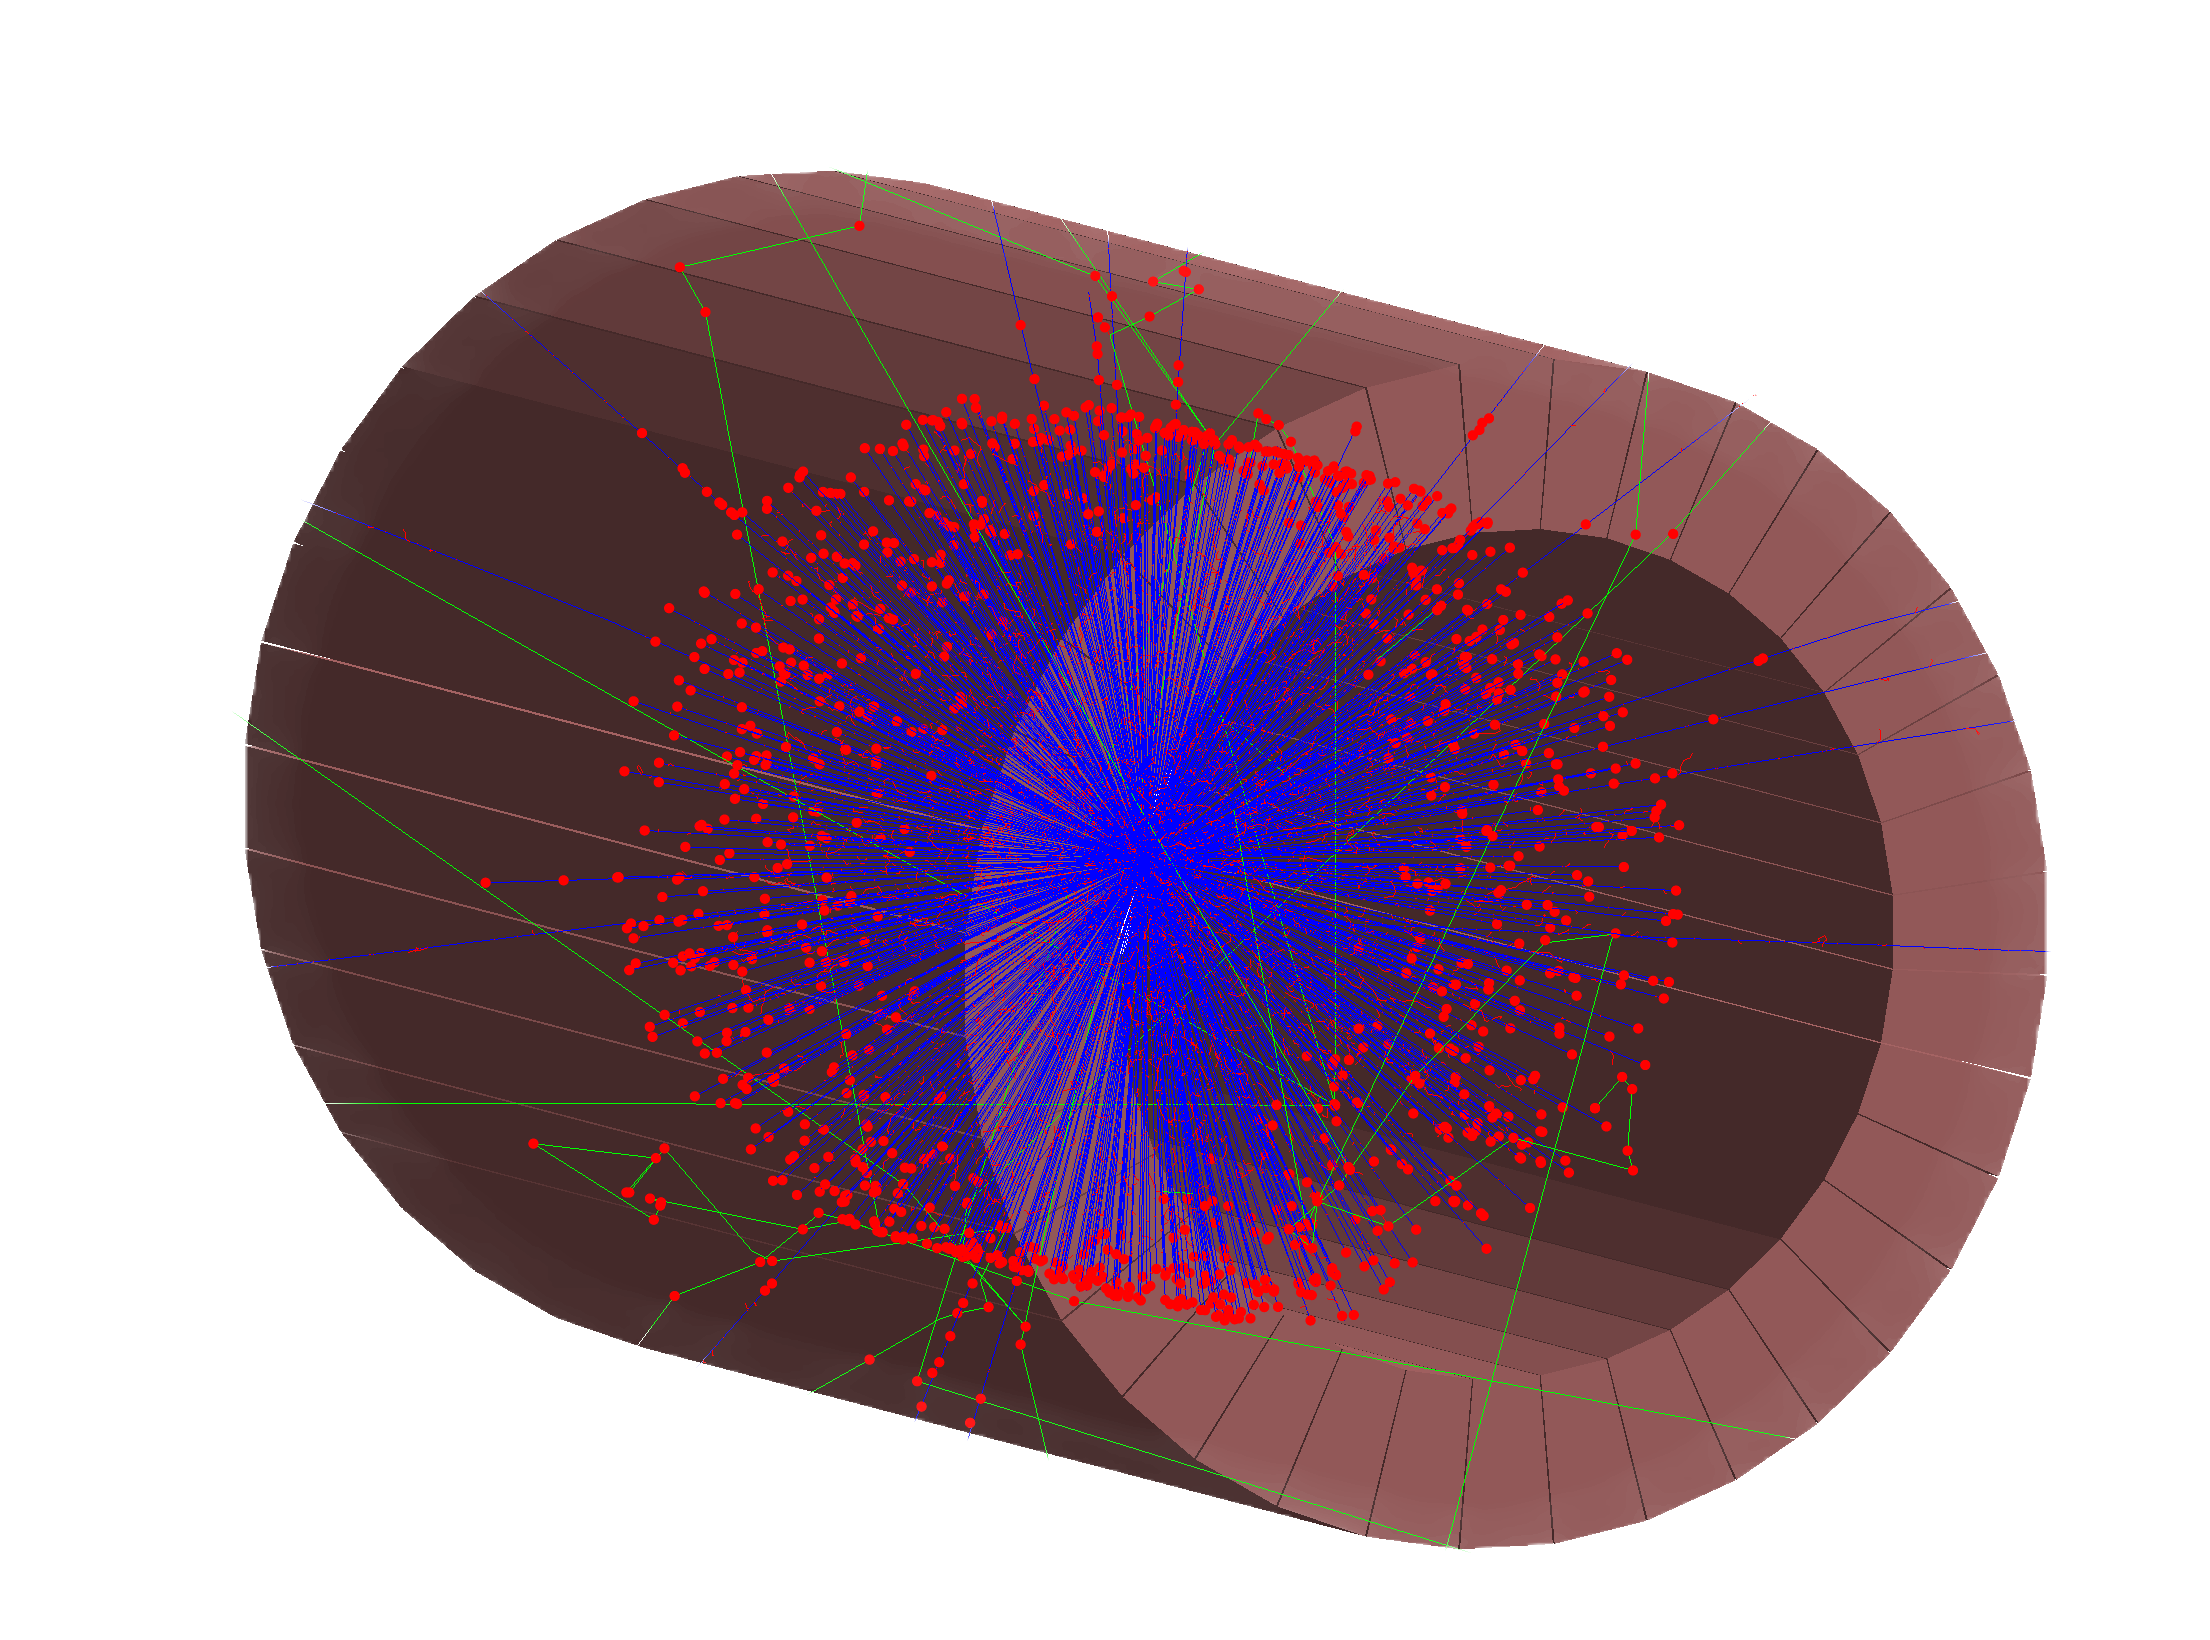
Another picture with 1000 events, with hits in the sensitive bars:
After running, the produced root file can be inspected:
root
TFile f("events.root")
f.ls()
This will show the following branches in the output file:
- header: GEMC Root Event Header
- trueInfo_flux: True Info Data Root Tree
- digitized_flux: Digitized Data Root Tree
The variables’ names in each branch can be listed and plotted. For example:
digitized_flux->Print()
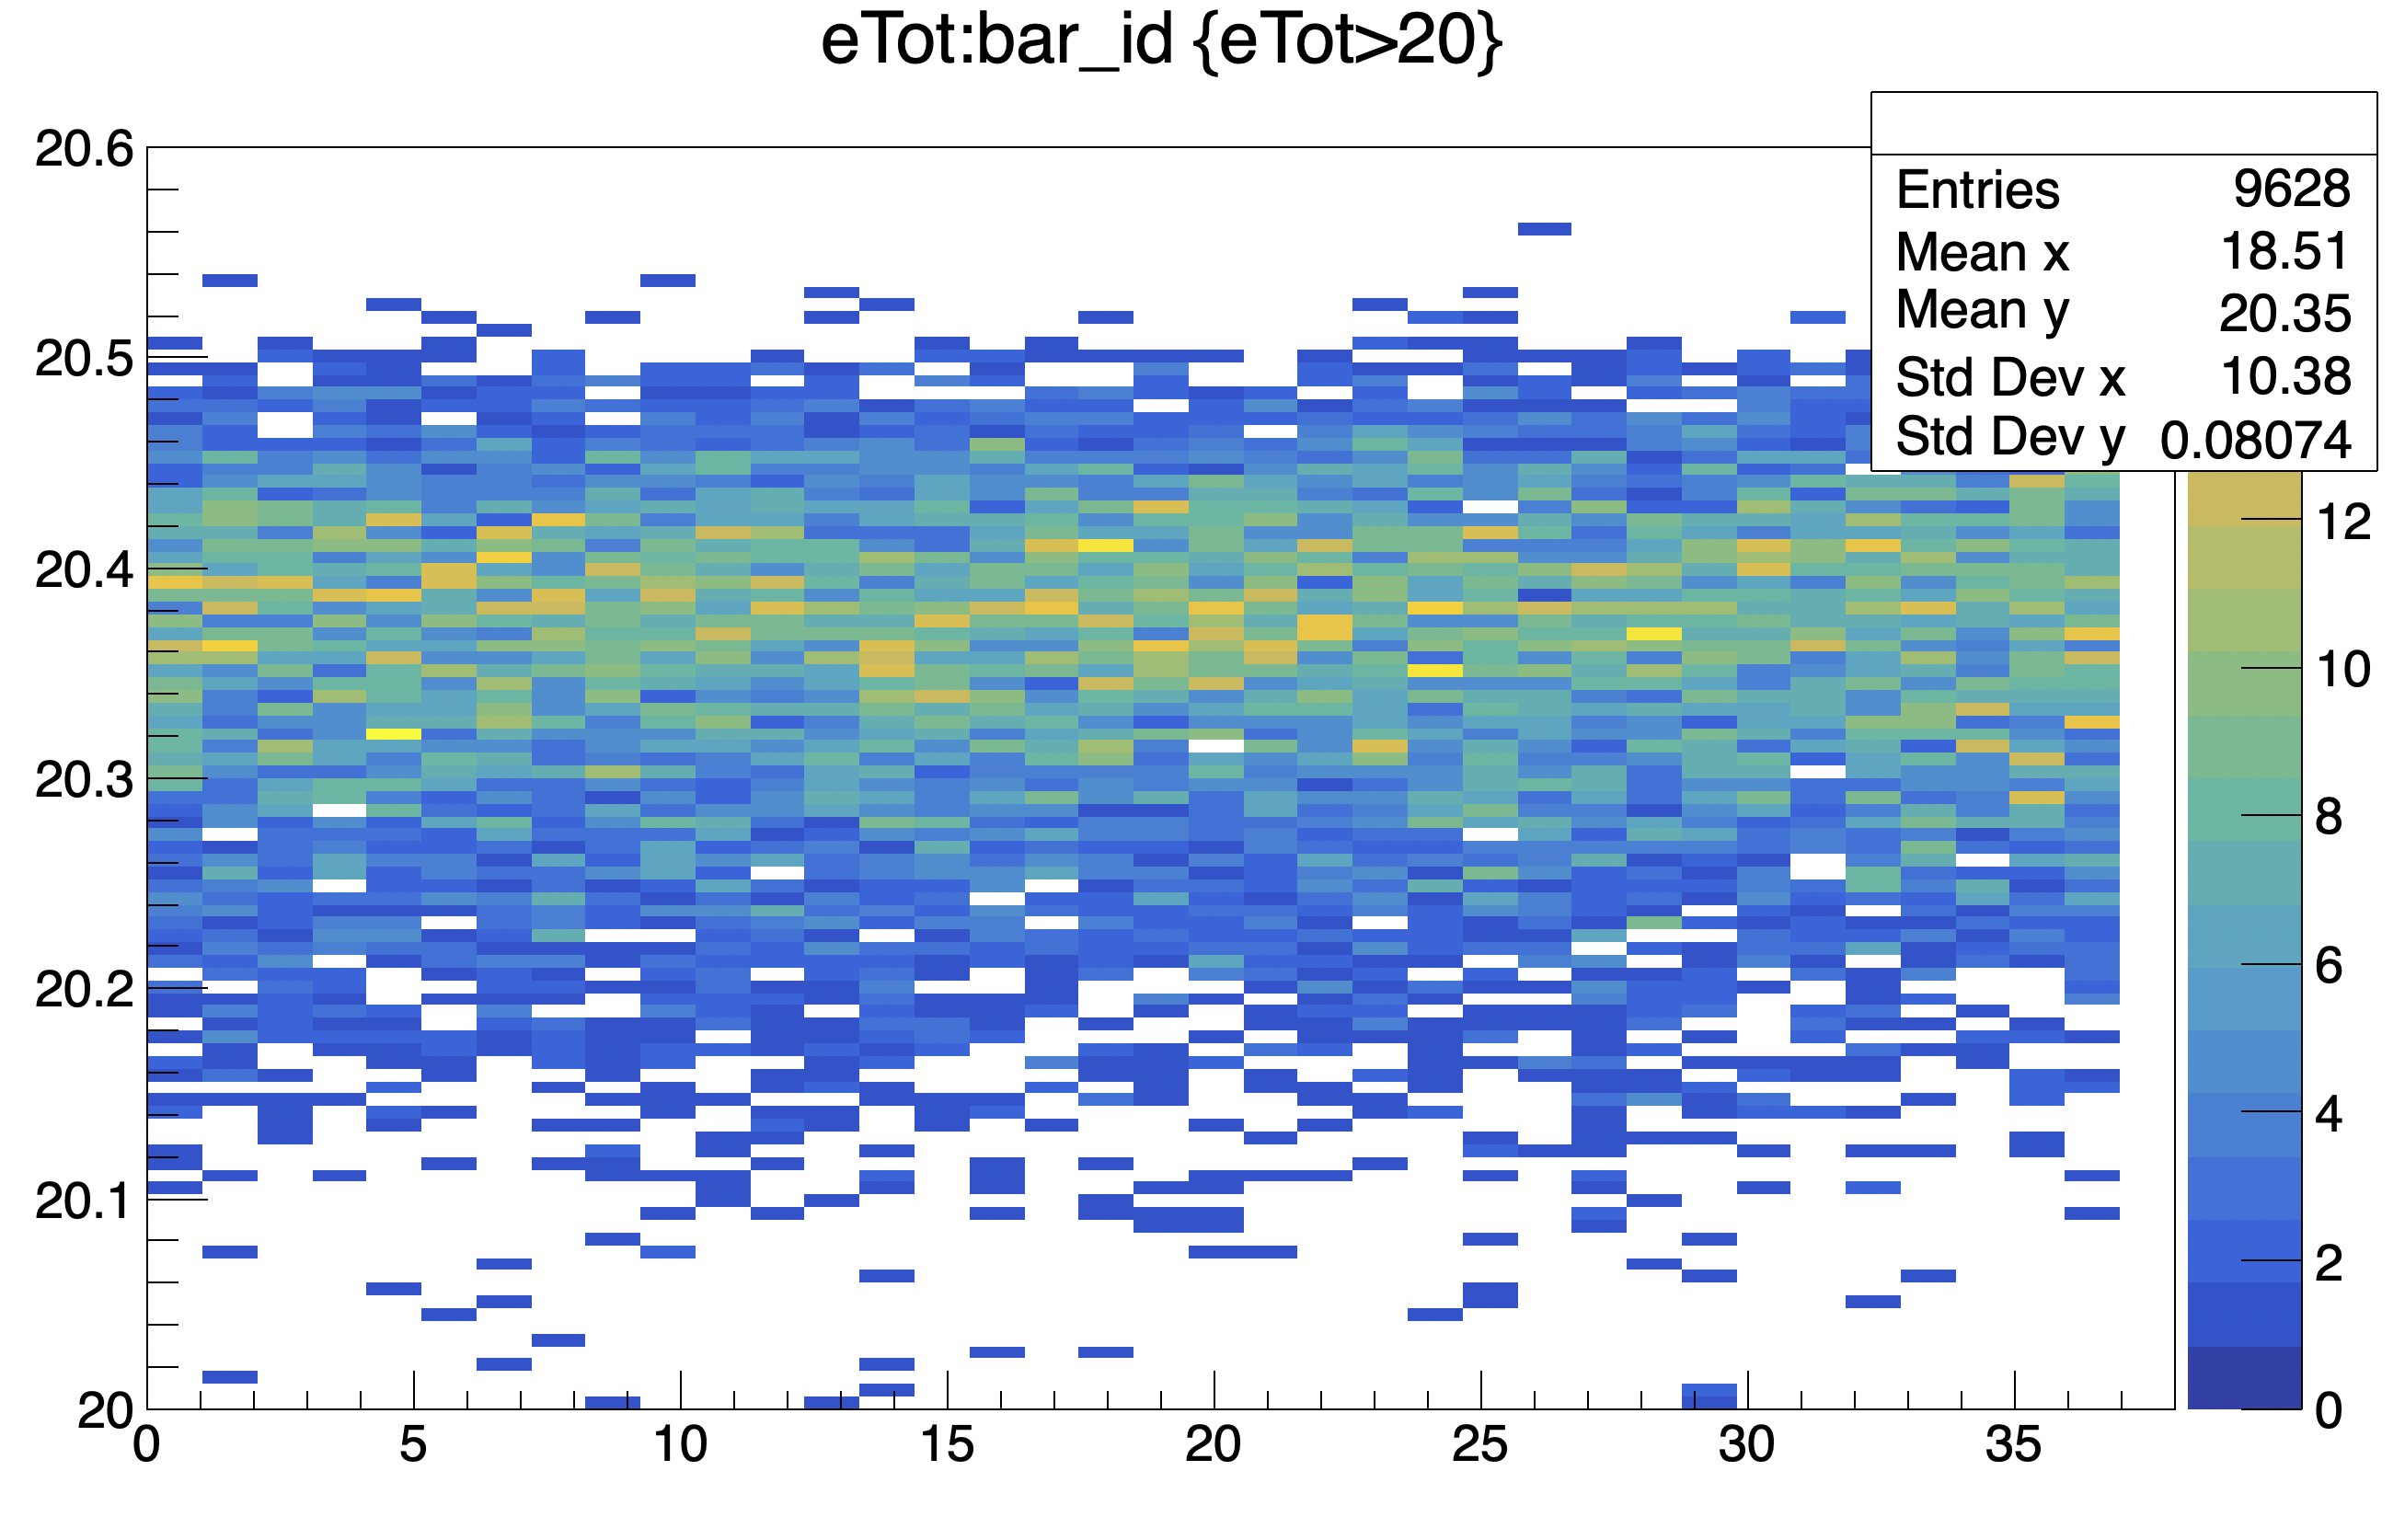
digitized_flux->Draw("eTot:bar_id>>(37, 0, 38, 100, 20.0, 20.6)", "eTot>20", "colz")
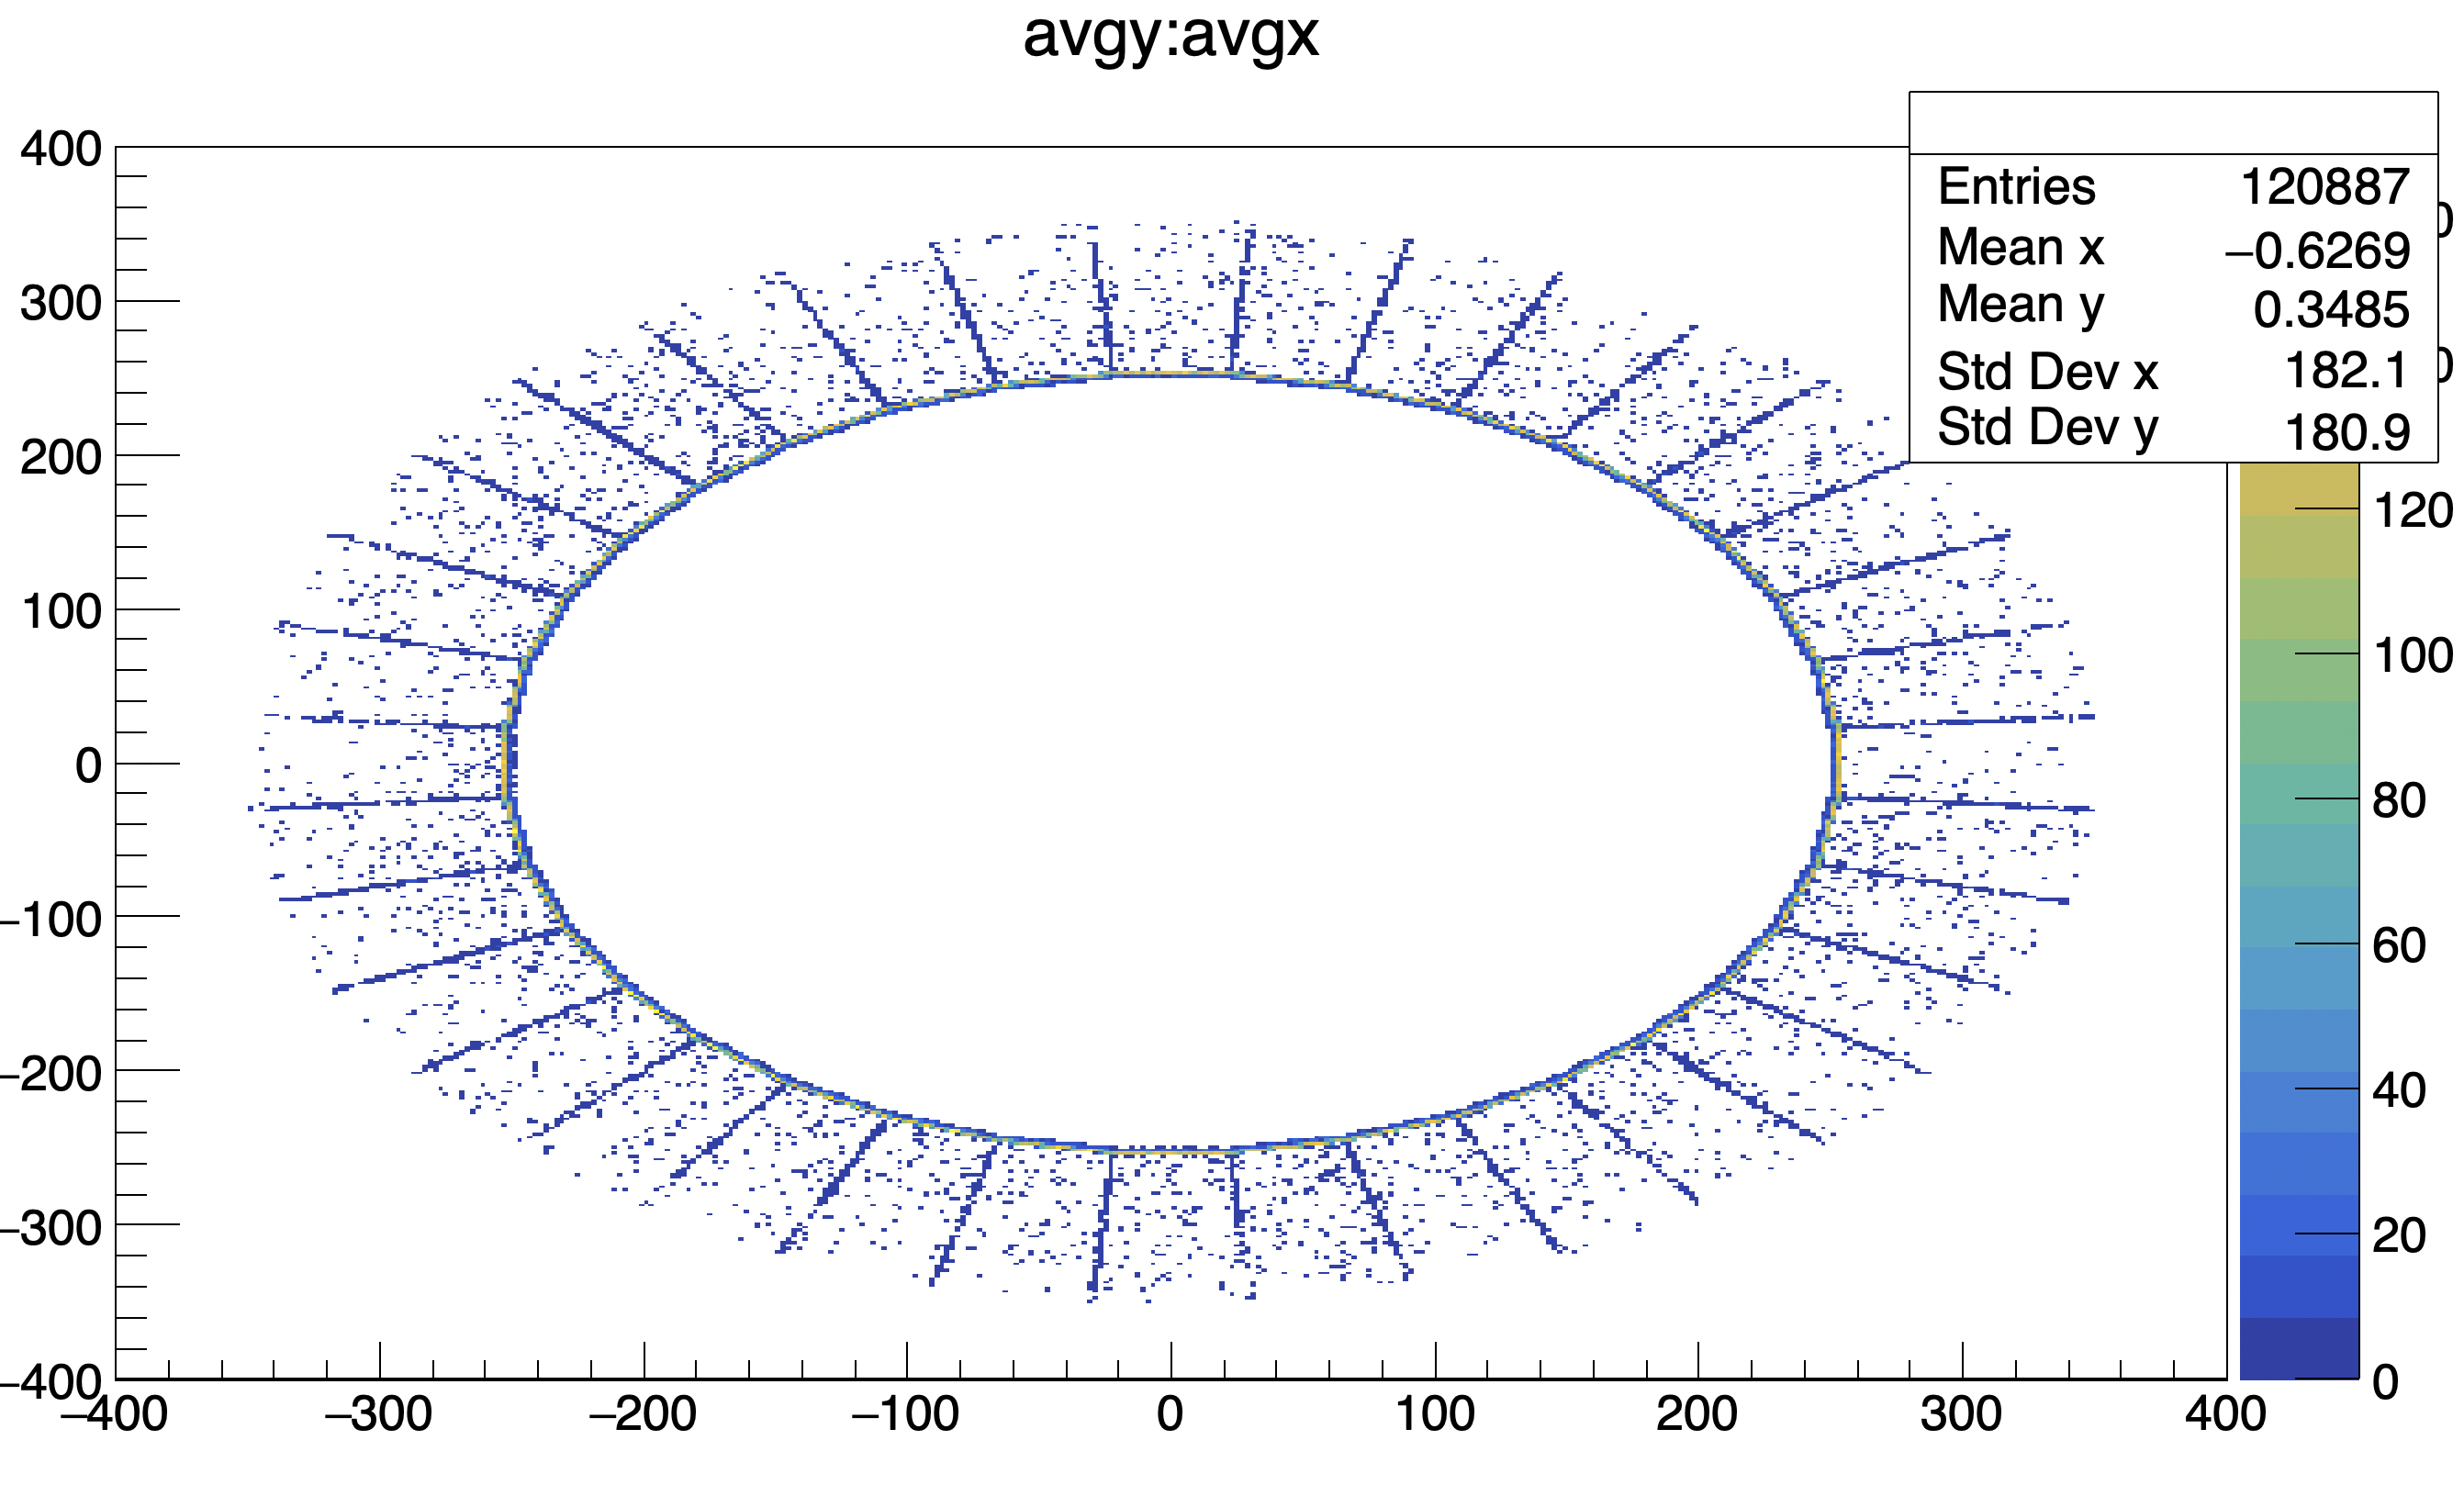
trueInfo_flux->Draw("avgy:avgx>>(400, -400, 400, 400, -400, 400)", "", "colz")
will show the energy deposited in the bars versus bar id and the hit positions in the x-y plane:
[ ]
]
[ ]
]
The code that produce the geometry: